Reading forex charts can often feel like navigating through an intricate maze, especially for beginners. However, with the right guidance and understanding, you can master this art and make informed trading decisions. In this article, we’ll dissect the nuances of forex chart reading, explore common pitfalls, and provide actionable insights to enhance your Forex technical analysis skills.
Understanding the Basics of Forex Charts
Before diving headfirst into the complexities, it’s essential to grasp the basics of forex charts. Forex charts are graphical representations of currency price movements over time. These visual tools are fundamental in Forex technical analysis, aiding traders in identifying trends, patterns, and potential trading opportunities. There are different types of charts, and each serves a unique purpose.
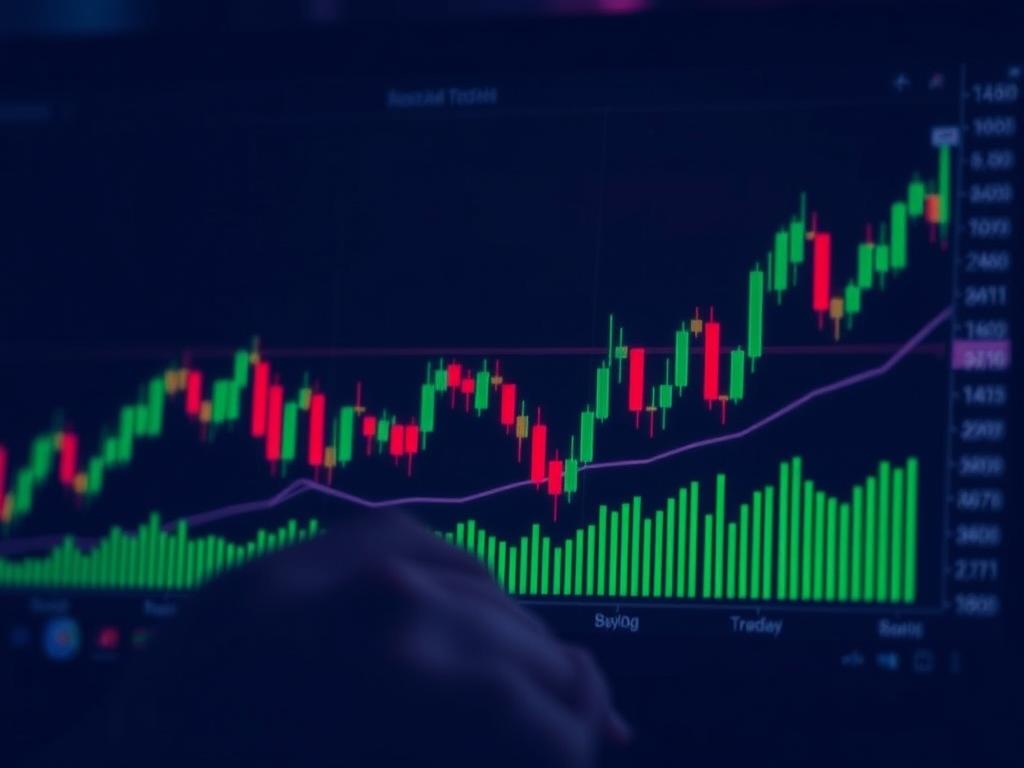
One of the most popular types is the line chart. It connects closing prices over a specified period, providing a simplified view of price movements. Meanwhile, bar charts offer a more detailed perspective, displaying opening, closing, high, and low prices. Then there’s the candlestick chart, cherished for its visually appealing and informative nature. Each candlestick represents the price movement for a set period, providing insights into market sentiment.
The Importance of Timeframes
Timeframes are integral to reading forex charts. They determine the granularity of data displayed, influencing your trading decisions. Traders often employ multiple timeframes to gain a comprehensive view of market conditions. Common timeframes range from minutes to months, and selecting the appropriate one depends on your trading style and goals.
For instance, short-term traders might prefer the 5-minute or hourly charts, which capture rapid market fluctuations. Conversely, long-term investors lean towards daily or weekly charts, seeking to identify broader trends. Balancing multiple timeframes enables traders to align short-term tactics with long-term strategies, minimizing risks and maximizing gains.
Common Pitfalls in Reading Forex Charts
Despite their utility, forex charts can be tricky to interpret, especially for newcomers. Here are some common pitfalls to be wary of:
Relying Solely on Technical Analysis
While Forex technical analysis is indispensable, relying exclusively on it can be a pitfall. It’s crucial to consider fundamental factors that might impact currency movements, such as economic news releases, geopolitical events, and interest rate changes. Ignoring these elements can result in misleading interpretations and poor trading decisions.
Overcomplicating Charts with Indicators
Indicators are designed to enhance your chart analysis, but overcrowding your charts with too many can lead to confusion and analysis paralysis. Select a few key indicators that complement your trading strategy and apply them judiciously. Popular indicators include moving averages, RSI (Relative Strength Index), and MACD (Moving Average Convergence Divergence).
Ignoring Market Trends
In the world of forex trading, the trend is your friend. Ignoring prevailing market trends can lead to significant losses. Ensure you identify and follow major trends when making trading decisions. Use trendlines and moving averages to assist in confirming trend directions.
Enhancing Your Forex Technical Analysis
To improve your Forex technical analysis and avoid common pitfalls, consider these strategies:
Consistent Practice and Education
Like any skill, mastering how to read forex charts requires consistent practice and ongoing education. There are numerous online courses, webinars, and tutorials available that can help hone your analysis skills. Engage with trading communities and forums to learn from experienced traders.
Developing a Trading Plan
A well-structured trading plan is critical to success. Define your trading goals, risk tolerance, and preferred trading style. Determine your entry and exit strategies, and stick to them. A solid plan serves as a roadmap, guiding your decisions and helping you stay disciplined in volatile markets.
Utilizing Technological Tools and Resources
Leverage technological tools and resources to enhance your Forex technical analysis. Charting platforms like MetaTrader and TradingView offer advanced features and indicators that can provide deeper insights into market trends. Additionally, consider using automated trading systems and expert advisors to streamline your decision-making process.
Keeping an Eye on Emotional Factors
Fear and greed are powerful emotions that can cloud judgment. Recognize these emotions and work on managing them effectively. Set realistic expectations, maintain discipline, and don’t let emotions drive your trades. Utilizing stop-loss orders can also help mitigate emotional biases by limiting potential losses.
Conclusion
Reading forex charts is a pivotal skill for any forex trader, and while it can appear daunting, it is certainly manageable with the right knowledge and approach. By understanding the basics, avoiding common pitfalls, and enhancing your Forex technical analysis, you can navigate the forex market with confidence. Remember to practice consistently, stay informed, and always adhere to your trading plan. With time and experience, you can master the art of reading forex charts and make informed, profitable trading decisions.